Accelerated Real-World Insight: How AI and Claims Data Rapidly Turn Gaps into Health Equity Action
Authored by: Jo Ann Saitta and Jack Wildasin
The challenge
Despite decades of medical progress, millions of cardiovascular patients, particularly women and minorities remain invisible to the healthcare system. Many go undiagnosed, untreated, or disengaged from care. With cardiovascular disease still the leading cause of death for women in the U.S., and Black women facing the highest maternal mortality rates, data alone isn’t enough¹. The question becomes: how can pharma and healthcare systems use real-world data and AI to turn this crisis into action?
That’s the challenge we tackled at Putnam using national-scale cardiovascular claims data and AI analytics.
Using recent research, we used AI to rapidly uncover where health equity gaps are greatest. We looked at structured and unstructured claims data over the last two years for the top diagnoses (hypertension, myocardial infarction and cerebral infarction) and generated human-validated strategies on how pharma can help healthcare providers address them.
What did the data show?2
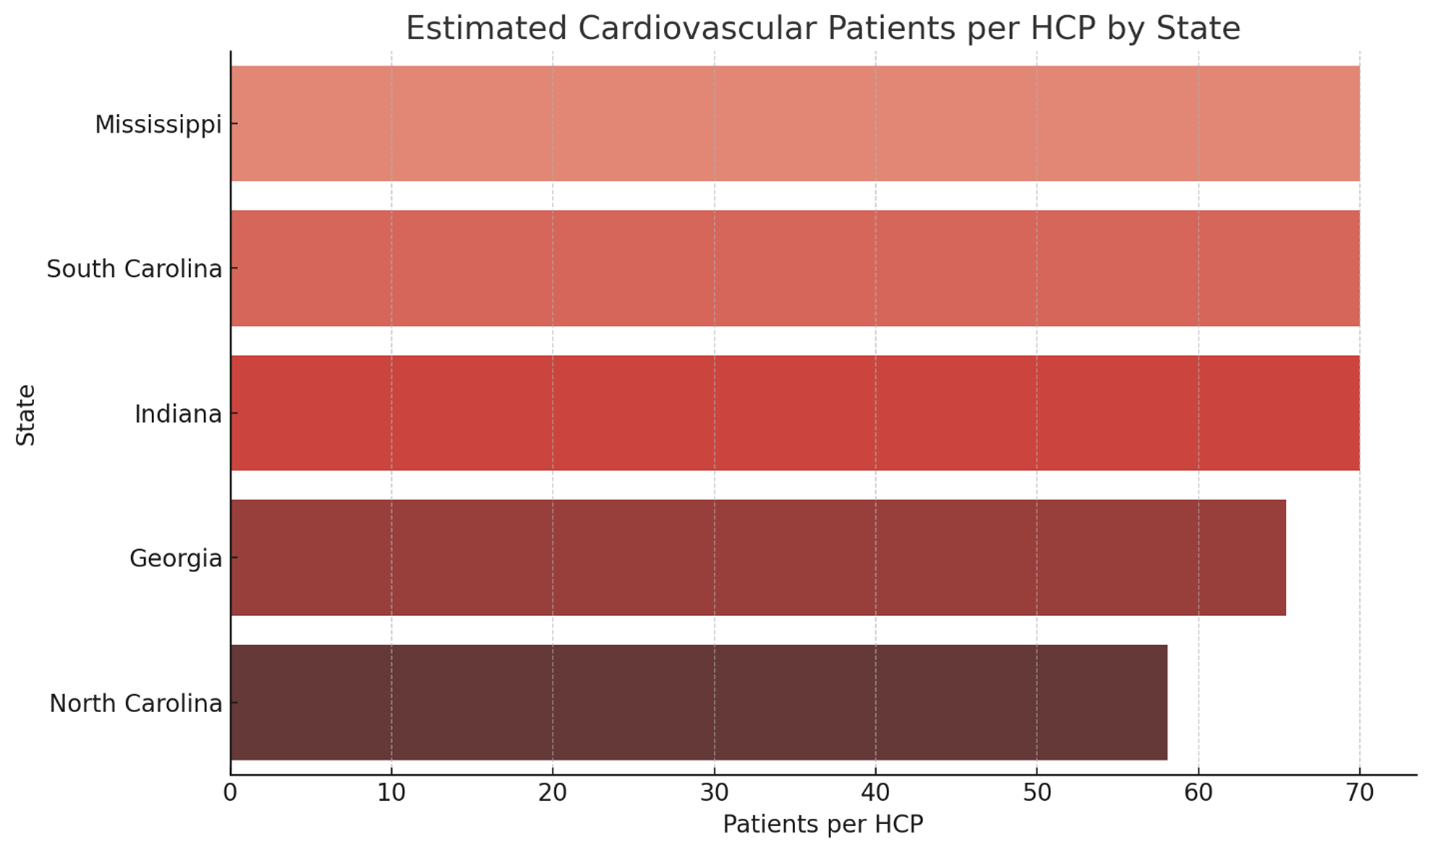
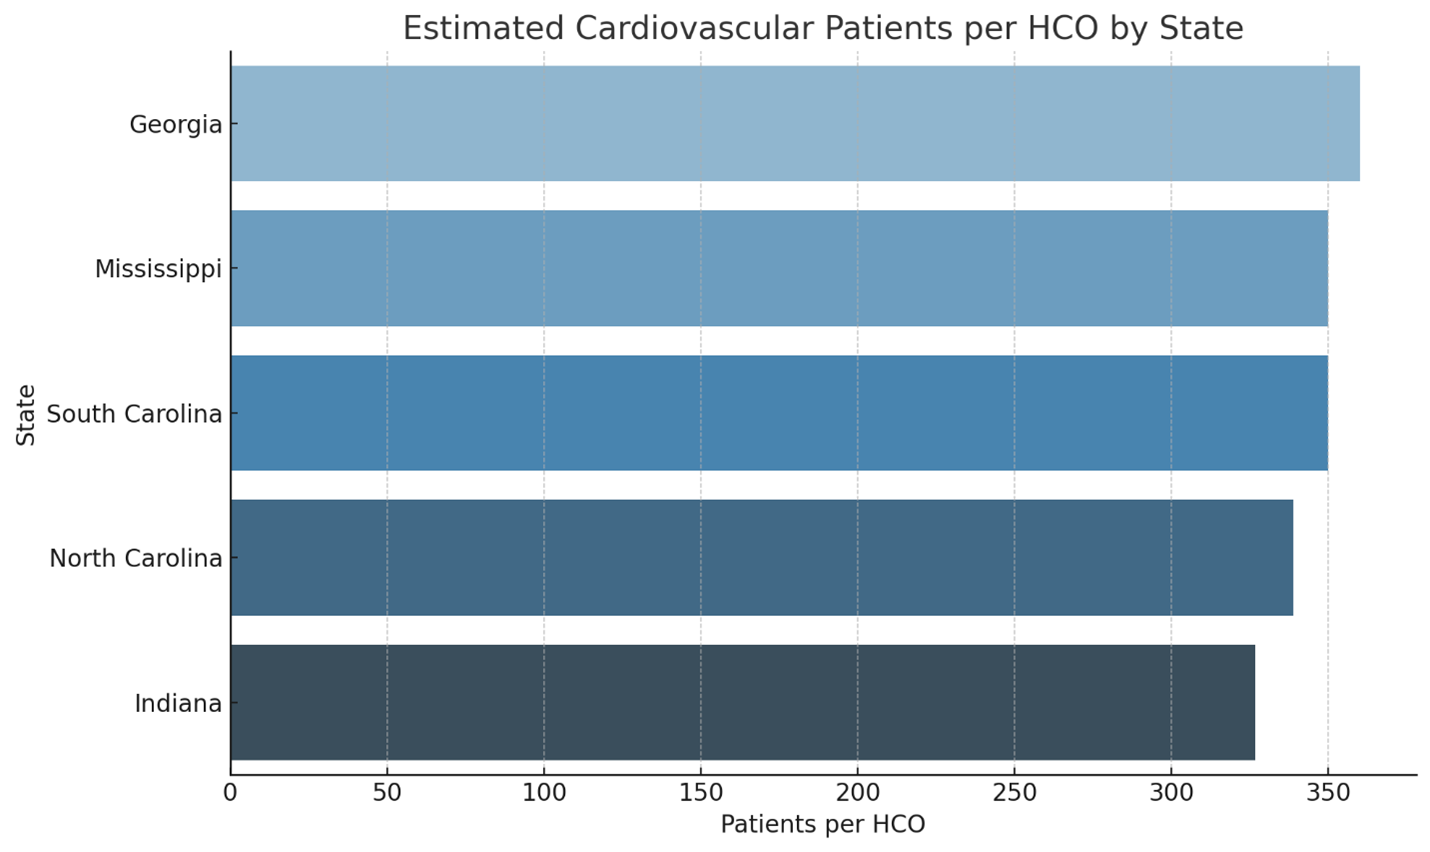
- Uneven Access at Scale: Over 89 million CVD patients generated nearly 800 million healthcare visits across 1.6 million providers and 275,000 organizations. But many states – Mississippi, Georgia, North Carolina, South Carolina, Indiana – had high patient volumes but disproportionately low provider density, especially among aging, Black, rural, and low-income communities.
- Widening Strain on Providers: The number of active healthcare organizations dropped from 230,000 to 146,000 in just two years, making access even tougher where patient need is highest.
- Greatest Risk Among Seniors: The highest disease burden falls on the 65–88 age group, highlighting an urgent need for engagement in retirement communities and among older patients.
- Specialty Gaps: While Internal Medicine, Interventional Cardiology, and General Cardiology are central to CVD care, many areas lack ready access to these providers or to specialty support like nephrology or thoracic surgery.
Our Solution
At Putnam, we begin with a human-in-the-loop approach. Qualitative studies and expert engagement help us understand where patients fall out of care and why, ensuring insights are grounded in real-world experience, not just numbers.
We then apply AI and claims analytics to rapidly pinpoint where disparities exist and how to act.
Rapidly Pinpointing Underserved States with AI Tools: By mapping patient-to-provider ratios, AI identified states where targeted outreach could make the biggest difference. For example, Mississippi and Georgia emerged as high priority “pressure points” where provider shortages and high CVD burden collide:
- Enabling Tailored Provider Messaging: Data-powered strategy enabled specific calls to action for local providers:
- Mississippi: “A simple risk check could be the first step in saving a life.”
→ Action: Launch free monthly CVD screenings in retail pharmacies and local health departments; incentivize Medicaid managed care for early screening. - Georgia: “Increasing early screening in your practice can help reverse current trends.”
→ Action: Deploy ‘Know Your Numbers’ campaigns, mobile screenings in rural areas, and education partnerships with churches and community centers. - Indiana and the Midwest: Promote digital self-assessment kiosks in community clinics and expand telecardiology access for rural providers.
- Mississippi: “A simple risk check could be the first step in saving a life.”
The Results
Designing Local Solutions: In each hotspot, AI surfaced engagement strategies, such as EHR plug-ins to flag high-risk patients, digital toolkits, and CME-accredited training for primary care and nurse practitioners, helping providers recognize and retain at-risk individuals.
Bridging the Last Mile: Maps and dashboards visualized where the greatest mismatches between need and access existed, enabling the client to project focus resources and partnerships where they’ll have the most impact.
At Putnam AI is central to speed analysis of complex multi-modal sources of data, whether spreadsheets, tables, charts, or figures. By synthesizing this data faster than traditional methods, our Data Teams stay at the forefront of business analytics and solving the challenges in bridging health inequity gaps.
Want to learn about the techniques using claims data and AI and uncover health equity disparities in record time?
Contact us
Sources:
- American Heart Association. (n.d.). Go Red for Women: Facts. Go Red for Women. Retrieved July 28, 2025, from https://www.goredforwomen.org/en/about-heart-disease-in-women/facts
- Putnam Claims Analysis, June 2025

Jump to a slide with the slide dots.
Patient Finding Through Data Tokenization
Refined HCP targeting in rare disease using integrated data, boosting hit rates from 10% to 50% and delivering 3x ROI in 6 months.
Read moreDigital share of voice and sentiment analysis at key congress
Used GenAI to benchmark digital voice in oncology, boosting engagement & leadership via LinkedIn, DEI & clinical messaging.
Read moreData Strategy Development
Future-proofed data strategy with Putnam: gaps identified, vendors vetted, leading to a first US multi-source tokenized DB.
Read more